A 60-Day (Conditional) U.S.-Iran Peace Deal
Why Hormuz at 82% utilization implies a 2% valuation premium hiding 30% LNG NPV hits

It’s that time of the week. An eventful one filled with promises of an open Strait of Hormuz and everything in between. This of course deserved a deep dive, yès or yés?
Context
The 2026 Iran war began in late February and effectively closed the Strait of Hormuz to commercial traffic, combining Iranian restrictions with a US naval blockade. A huge jet fuel crisis unfolded as many of you remembered. Around mid-June 2026, Washington and Tehran signed an interim memorandum of understanding for a 60-day framework covering ceasefire, safe passage (initially toll-free), asset releases, and limited sanctions relief. Tankers, including LNG carriers from Qatar and Saudi supertankers, began moving, and Brent dropped sharply toward 3-month lows in the $79 to $83 range from wartime peaks of $100 to $126.
That narrative flipped on June 19. Iran declared the Strait “closed again,” citing unmet conditions: full Israeli withdrawal from Lebanon, a complete lifting of the US naval blockade, and US force withdrawals from the region. The same day, Israel and Hezbollah agreed to a ceasefire effective 4pm local time.
A leviathan of our industry, Javier Blas, published maps showing Iran has already redrawn the traffic separation scheme, pushing the new lanes south of those it unveiled weeks ago, while imposing a large ,,Hazardous Area, Restricted for All Traffic” zone in the central and southern strait. The Omani lane remains as Figure 1 shows. The signing ceremony in Switzerland was postponed.
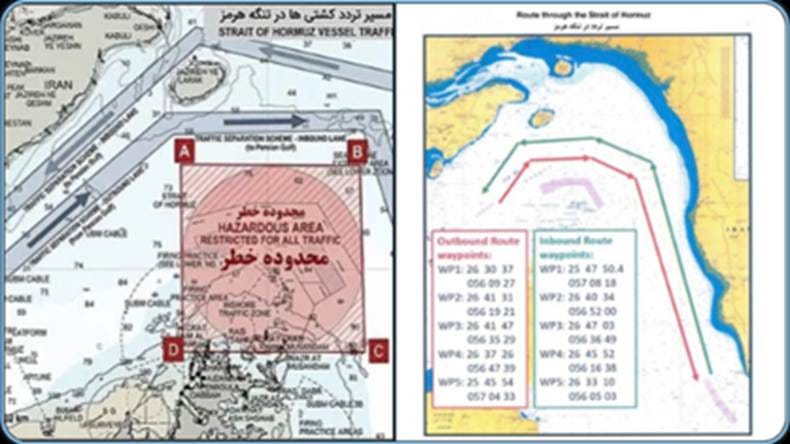
Long story short: the deal exists on paper, but the on-the-water reality is conditional, Iranian-administered, and reversible.
Why this news matters
Hormuz carries roughly 20% of global seaborne oil and a disproportionate share of LNG, with Qatar especially exposed. The pre-war run rate of about 120 vessels per day collapsed to a trickle, and the post-deal trickle has only marginally improved. The Blas maps matter because they show Iran is “moving at light speed” to establish de facto control over routing, restricted zones, and the eventual fee regime as talks between Tehran and Muscat on administration of maritime services are already referenced in the MOU.
This is not a return to normal. It is the construction of a new normal in which Iran owns the rules of passage. For markets, that distinction is the entire story: the difference between mean reversion to roughly $70 to $80 Brent and a $5 to $15 sustained risk premium, between full LNG utilization and 60% to 70% effective throughput, between a clean DCF and one with elevated geopolitical betas.
A system dynamics lens
System dynamics is the right grammar for this market because the relevant variables are stocks, flows, delays, and feedback loops, not point estimates.
The core stocks on Figure 2 are global oil and LNG inventories (heavily drawn down during the war), stranded tankers in the Gulf, idle production capacity, and insurance risk premia. The core flows are daily transits (about 20.5M b/d through Hormuz pre-war out of a global baseline near 102M b/d), production restarts, and demand response. The delays are the binding constraint: de-mining takes weeks, war-risk insurance normalization takes weeks to months, and infrastructure repair takes longer (Qatari LNG facilities were hit, with roughly 17% of capacity reportedly impaired for 3 to 5 years).
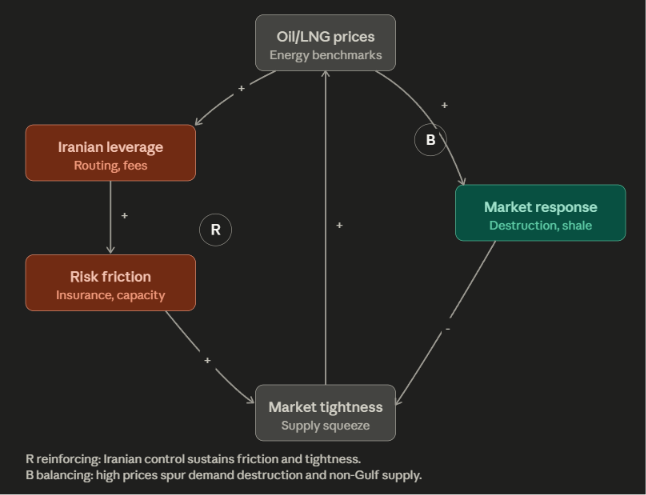
Two loops drive the dynamics. The balancing loop is familiar: higher prices trigger demand destruction, fuel switching, and incremental non-Gulf supply (notably US shale), eventually rebuilding inventories. The reinforcing loop is the new feature: Iranian control and new lanes raise perceived risk, which lifts war-risk premiums and slows shipper confidence, which lowers effective capacity utilization, which sustains tightness, which raises prices, which in turn increases Iran’s incentive to leverage control through fees or routing rules.
A simple simulation grounded in those parameters (effective Hormuz capacity ramping slowly to roughly 82% of normal in the friction scenario) keeps prices around $99 at six months and $92 at one year, with gradual rebalancing into 2027. A quick reopening reverts prices toward $80 within months as inventories rebuild. The gap between those two paths is the price of friction.
Valuation scenarios: Damodaran applied
Damodaran’s framework is straightforward: value equals the present value of expected free cash flows plus a terminal value, discounted at WACC, with explicit adjustments for country risk, geopolitical beta, and normalized earnings. The system dynamics output of price paths and utilization curves feeds directly into the cash flow and discount rate assumptions.
Applied to a hypothetical Gulf-exposed portfolio with normalized annual cash flow of $100 at $80 oil, a base WACC of 9% (which rises to 10% to 12% in the friction case), terminal growth of 2%, and a 10-year explicit horizon plus terminal value, the two scenarios produce surprisingly close numbers:
The quick normalization scenario values the portfolio at roughly $1,257. The friction or managed reopening scenario values it at roughly $1,283, a modest 2% premium. Higher near-term cash flows from elevated prices are largely offset by delayed volumes, a higher WACC, and Damodaran’s insistence on mean-reverting terminal margins.
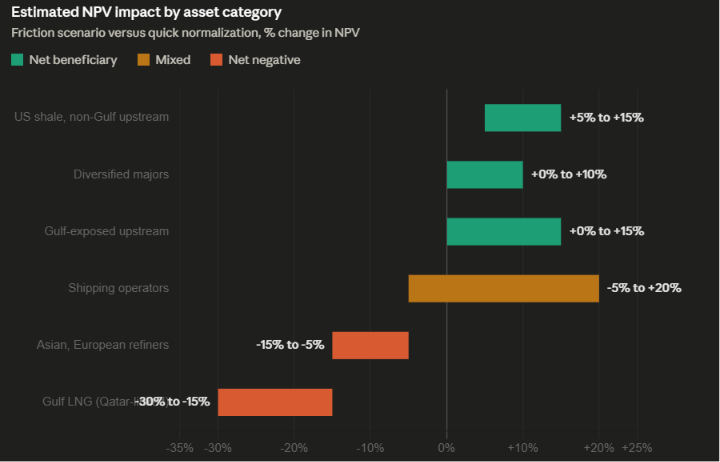
The sensitivities are where the action is on Figure 3. A harder friction case (long-term capacity stuck at 70% plus Iranian fees) lifts the near-term Gulf producer premium to 5% to 15%, but Asian and European importers and high fixed-cost Gulf LNG projects see the opposite. LNG project NPV is the most exposed line: a 20% utilization haircut for one to two years combined with elevated shipping costs can shave 15% to 30% off project NPV, with Qatar-linked trains penalized most. On multiples, EV/EBITDA and P/CF compress for Gulf-concentrated assets while expanding for diversified US names; Cheniere’s structural diversification supports a premium, Qatar and Saudi-linked entities trade at a discount until clarity returns.
The workflow itself is directionally useful, not surgically precise. Confidence intervals on specific price and valuation outputs are wide here, plausibly ±25% to ±40%, given the geopolitical jump risk, data gaps on repair timelines and prospective Iranian fees, and the nonlinearity of any single incident in or near the strait. It is a scenario tool, not a forecast.
So, what for commodity markets
The bottom line for commodity markets is that this is not a snap-back, it is a managed transition. Pricing reflects that.
For oil, the immediate relief rally took Brent toward $80, but the embedded risk premium of $5 to $15 holds prices in an $80 to $95 trading range through late 2026, with full normalization slipping into 2027. Inventory rebuilds support prices on the back end even as flows resume on the front end. Volatility stays high because every Iranian statement, every AIS data point, and every insurance rate revision moves the curve.
For LNG, the picture is worse. Qatari concentration, slower repair timelines, and the absence of easy substitution mean wider Asian and European spreads, higher spot prices for longer than oil, and a slower path to utilization normalization. The European gas market eased on the deal but remains a coiled spring on any re-disruption.
The redistribution is large in dollar terms. Sustained $5 to $15 premia and LNG spread widening reallocate hundreds of billions of dollars from importers to Gulf producers, with secondary winners in US and non-Gulf supply and in shipping operators willing to navigate the new lanes. The losers are European and Asian importers, consumers exposed to energy pass-through inflation, and high fixed-cost Gulf LNG projects whose NPVs compress under the utilization haircut.
For investors and traders, the watchlist is concrete and unromantic: actual AIS transit counts, war-risk insurance rates, compliance with the 60-day window, the Switzerland signing if it happens, and Iranian follow-through on whether the Hezbollah ceasefire is treated as one of its preconditions met. Headlines matter less than the water.
Conclusions
The Hormuz reopening is not a resolution; it is a fragile, Iranian-managed transition. System dynamics say prolonged tightness with a reinforcing risk loop. Damodaran says modest net uplift for diversified majors, 15% to 30% NPV pain for exposed LNG, and discounts for Gulf concentration.
Commodity markets stay in an $80 to $95 oil regime and wide LNG spreads into 2027. Last but not least, watch the water, not the press releases.
On To The Next One.
FVR
References:
Primary Sources on Hormuz & Javier Blas Tweet
Javier Blas on new Iranian shipping lanes / maps (core tweet referenced):


LinkedIn post by Javier Blas on Hormuz routing changes: https://www.linkedin.com/posts/javier-blas-363b9512_hormuz-iran-oil-activity-7448401007224446976-Nsom
Bloomberg Opinion on Hormuz reopening expectations: https://www.bloomberg.com/opinion/articles/2026-06-08/brace-for-a-flood-of-oil-as-soon-as-the-strait-of-hormuz-reopens
Additional Blas coverage (e.g., observations, pipelines):
US-Iran Interim Deal & Strait Status
NBC News on Trump/Iran signing MOU (reopen Hormuz, sanctions relief, 60-day framework): https://www.nbcnews.com/world/iran/strait-hormuz-reopen-us-lift-iran-sanctions-14-point-deal-seeking-end-rcna350513
CNN live updates (deal, ships moving, Hormuz management): https://www.cnn.com/2026/06/18/world/live-news/iran-war-trump-israel-lebanon
Reuters on Vance, talks, and first tankers: https://www.reuters.com/world/middle-east/first-tankers-cross-strait-after-iran-deal-israeli-strikes-stir-doubt-lebanon-2026-06-18/
Atlantic Council expert reactions to interim deal: https://www.atlanticcouncil.org/dispatches/experts-react-the-us-and-iran-just-announced-an-interim-peace-deal-heres-what-we-know-so-far/
France 24 on Tehran-Washington MOU: https://www.france24.com/en/middle-east/20260618-tehran-and-washington-sign-interim-peace-deal-to-end-us-israeli-war-on-iran
Wikipedia summary of 2026 Iran war ceasefire/MOU: https://en.wikipedia.org/wiki/2026_Iran_war_ceasefire
Israel-Hezbollah Ceasefire (June 19, 2026)
CNN live updates: https://www.cnn.com/2026/06/19/world/live-news/iran-war-trump-israel-lebanon
AP News: https://apnews.com/article/iran-us-israel-lebanon-oil-june-19-2026-635ad6f41610df8355d24cc301a75fc4
Oil/LNG Prices & Market Impacts
Al Jazeera on price slide amid reopening hopes: https://www.aljazeera.com/amp/economy/2026/6/17/oil-prices-continue-slide-amid-hopes-for-peace-opening-of-strait-of-hormuz
CNBC on Brent below $80: https://www.cnbc.com/2026/06/16/us-iran-peace-agreement-oil-prices-tankers-strait-of-hormuz-transit.html
Bloomberg on oil falling below $80: https://www.bloomberg.com/news/videos/2026-06-16/oil-falls-with-us-iran-deal-set-to-add-wave-of-supply-video
Analytical/Valuation Context
S&P Global on oil price assumptions amid Hormuz disruption: https://www.spglobal.com/ratings/en/regulatory/article/oil-price-assumptions-raised-as-hormuz-disruption-deepens-and-inventory-buffers-erode-near-term-henry-hub-price-assumptions-lowered-s101689190
UNCTAD on economic burden of disruptions: https://unctad.org/publication/strait-hormuz-disruptions-burden-oil-price-shocks-vulnerable-economies
Substack analysis touching Damodaran-style valuation in Hormuz scenarios: https://fvr07.substack.com/p/the-500b-disruption-from-lng-to-jet